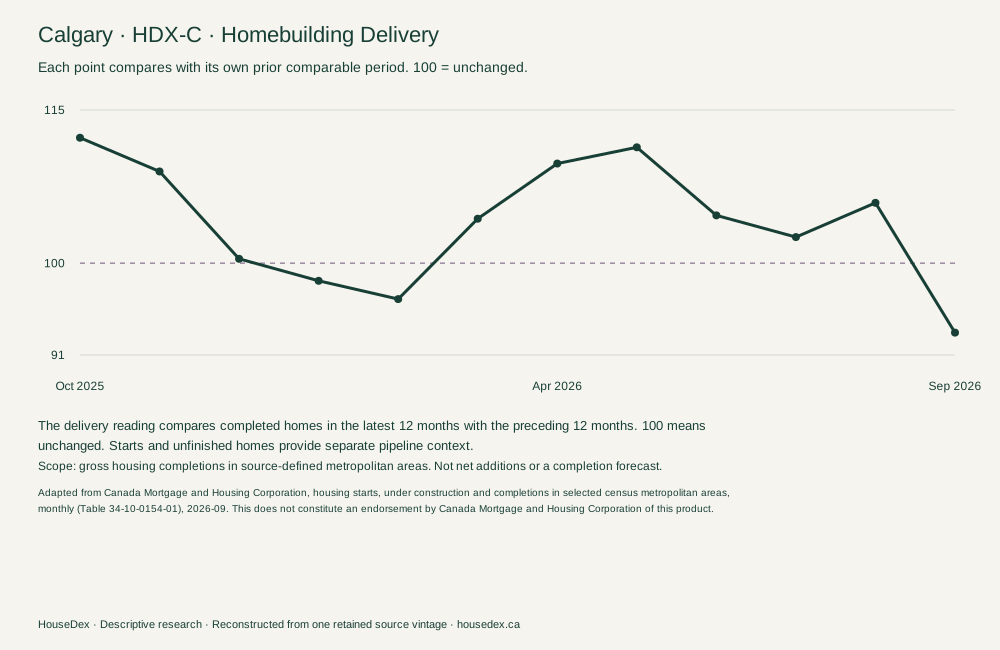
Completed homes down 6.8% over the comparable 12-month window.
-6.8%completion change
Latest 12 months compared with the preceding 12 months
Period ending September 2026 · Gross housing completions
Start with the story, then see the reading, the comparison and its limits.
Latest 12 months compared with the preceding 12 months
Period ending September 2026 · Gross housing completions
The delivery reading compares completed homes in the latest 12 months with the preceding 12 months. 100 means unchanged. Starts and unfinished homes provide separate pipeline context.
Why it matters: Finished homes measure delivery. New starts and homes still under construction describe earlier stages, which may not finish on a predictable schedule.
| Period ending | Reading | Completion change |
|---|---|---|
| Oct 2025 | 112.3 | +12.3% |
| Nov 2025 | 109.0 | +9.0% |
| Dec 2025 | 100.4 | +0.4% |
| Jan 2026 | 98.3 | -1.7% |
| Feb 2026 | 96.5 | -3.5% |
| Mar 2026 | 104.3 | +4.3% |
| Apr 2026 | 109.8 | +9.8% |
| May 2026 | 111.3 | +11.3% |
| Jun 2026 | 104.7 | +4.7% |
| Jul 2026 | 102.5 | +2.5% |
| Aug 2026 | 105.9 | +5.9% |
| Sep 2026 | 93.2 | -6.8% |
Reference period: October 2025 to September 2026.
Underlying releases: 19 October 2026. Existing rental and population pages retain their separately dated snapshots.
Adapted from Canada Mortgage and Housing Corporation, housing starts, under construction and completions in selected census metropolitan areas, monthly (Table 34-10-0154-01), 2026-09. This does not constitute an endorsement by Canada Mortgage and Housing Corporation of this product.
Market Balance and Home Supply need additional matched resale evidence and public-use clearance. Ownership Affordability needs matched household-income and ownership-cost inputs. Their readings remain unpublished.
Price Momentum begins with new homes; resale price coverage remains separate. Homebuilding begins with delivered homes; earlier pipeline stages remain distinct.