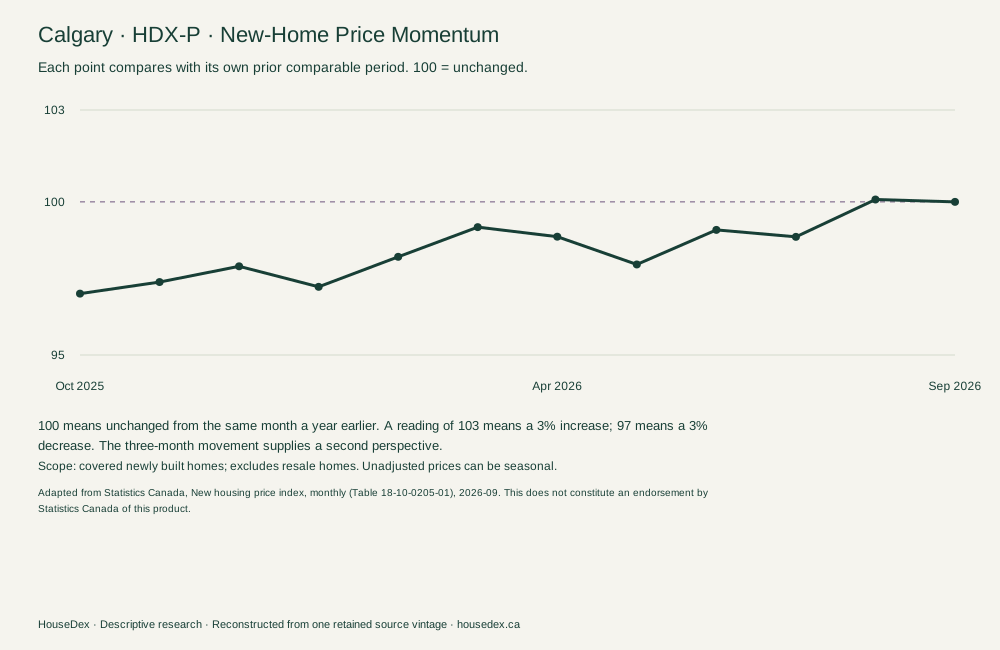
New-home prices little changed over the year; fell over three months.
0.0%annual change
-0.2% over three months
Period ending September 2026 · Covered newly built homes
Start with the story, then see the reading, the comparison and its limits.
-0.2% over three months
Period ending September 2026 · Covered newly built homes
100 means unchanged from the same month a year earlier. A reading of 103 means a 3% increase; 97 means a 3% decrease. The three-month movement supplies a second perspective.
Why it matters: The annual and recent movements can tell different stories. This helps distinguish a high price level from the direction prices are taking.
| Period ending | Reading | Annual price change |
|---|---|---|
| Oct 2025 | 97.0 | -3.0% |
| Nov 2025 | 97.4 | -2.6% |
| Dec 2025 | 97.9 | -2.1% |
| Jan 2026 | 97.2 | -2.8% |
| Feb 2026 | 98.2 | -1.8% |
| Mar 2026 | 99.2 | -0.8% |
| Apr 2026 | 98.9 | -1.1% |
| May 2026 | 98.0 | -2.0% |
| Jun 2026 | 99.1 | -0.9% |
| Jul 2026 | 98.9 | -1.1% |
| Aug 2026 | 100.1 | +0.1% |
| Sep 2026 | 100.0 | 0.0% |
Reference period: September 2025 to September 2026.
Underlying releases: 22 October 2026. Existing rental and population pages retain their separately dated snapshots.
Adapted from Statistics Canada, New housing price index, monthly (Table 18-10-0205-01), 2026-09. This does not constitute an endorsement by Statistics Canada of this product.
Market Balance and Home Supply need additional matched resale evidence and public-use clearance. Ownership Affordability needs matched household-income and ownership-cost inputs. Their readings remain unpublished.
Price Momentum begins with new homes; resale price coverage remains separate. Homebuilding begins with delivered homes; earlier pipeline stages remain distinct.